1998-2001 v.s. 2015-2018
and what we learned
|
Past and Present times, we studied Thompson creek
|
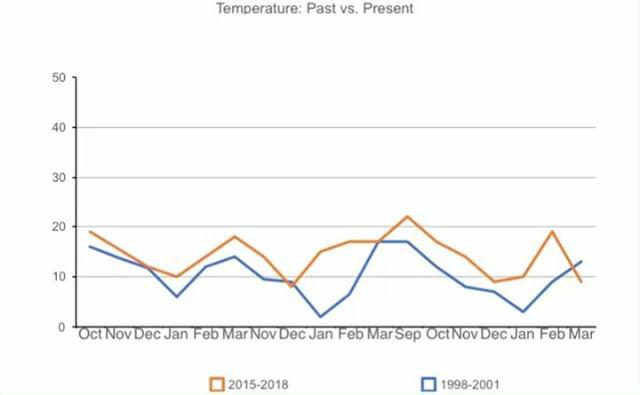
The temperature of the water was warmer through out the first Oct-Nov months, the drops colder in the month of Dec. It rises in Jan & Feb, then stays the same in march and rises through Mar-Feb. Becoming lower in the Mar. of 2015-2018
|
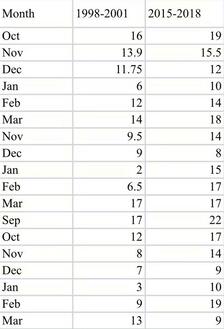
1998-2001: 10.37avg
2015-2018: 14.41avg Average Difference: 4.04 |
|
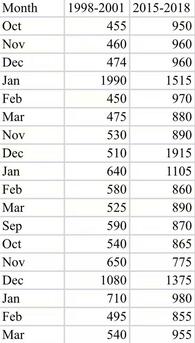
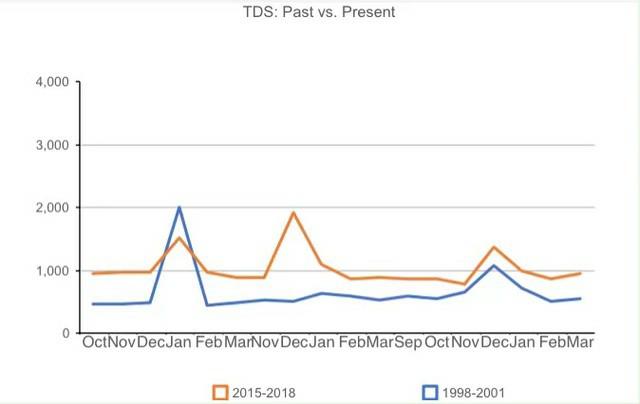
1998-2001: 650avg
2015-2018: 1031avg Average Difference: 381 |
The TDS level raised in Nov-Dec. Then lowered in Jan. The TDS level
then continue to rise from the first February it was tested, to the second
March.
then continue to rise from the first February it was tested, to the second
March.
|
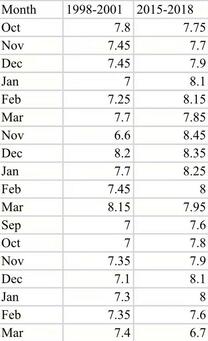
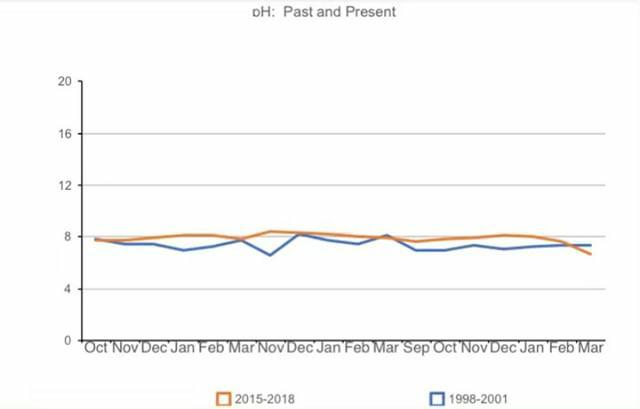
1998-2001: 7.4avg
2015-2018: 16avg Average Difference: 8.6 |
The PH level in 2015 was lower in oct. It continued to be higher from
Nov-Feb and droped again in Mar. It remained higher Until the second
Mar.
Nov-Feb and droped again in Mar. It remained higher Until the second
Mar.
|
|
|
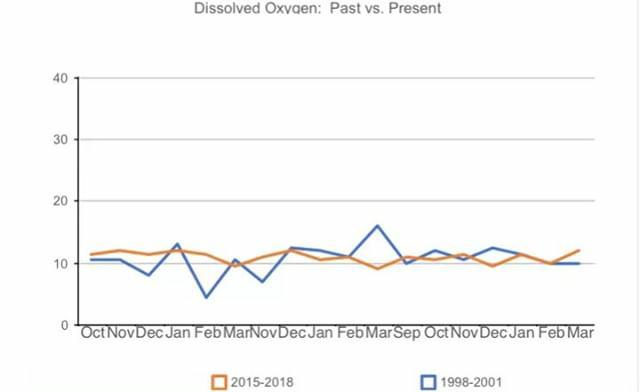
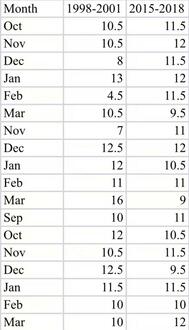
The ammont of dissolved Oxygen in was Higher in 2015-2018 from Oct-Feb. The levels became lower in Mar. It was Higher again in Nov, Then remained lower from Dec-Mar. The levels once again where higher in Sep, then where lower in Oct, and higher in Nov. Then remained lower Dec-Feb, and where higher in Mar.
|
1998-2001: 10.6avg
2015-2018: 10.9avg Average Difference: .2 |
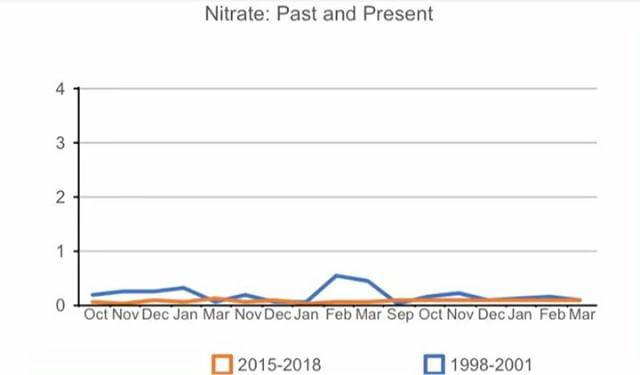
The amount of nitrate was lower in Oct-Jan in 2015-2018 It became higher in Mar-Dec. it was lower again in Jan-Sep. Then became higher in Oct-Mar remaining higher or equal to the 1998-2001 study period.
|
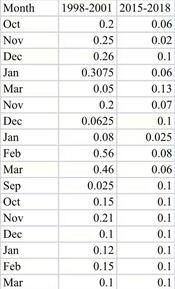
1998-2001: .18avg
2015-2018: .08 Average Difference: .1 |
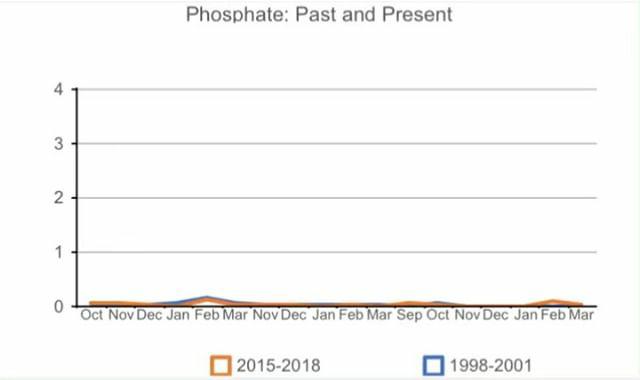
in Oct-Nov. it was higher in 2015-2018. It became lower in Dec-Nov. it become lower in the second Dec, and Jan. It Equaled out in Feb, The was higher Mar-Oct. It remained equal Nov-Jan. Then was warmer Feb & Mar.
|
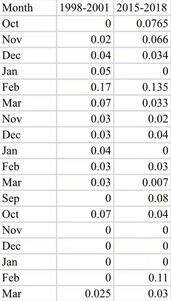
1998-2001: .03avg
2015-2018: .03avg Average Difference: 0 |
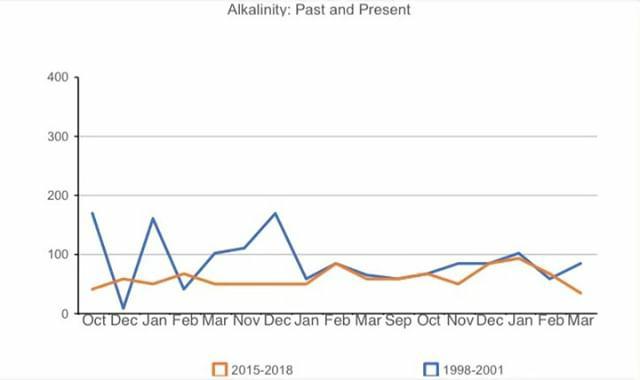
The alkalinity levels where lower in Oct. of 2015-2019, and then where higher in Dec, lower in Jan, and higher in Feb, then remained lower or equal from Mar-Mar.
|
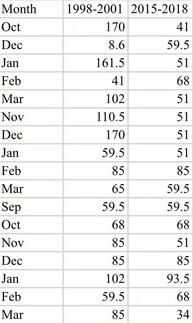
1998-2001: 84.2avg
2015-2018: 57 Average Difference: 27.2 |
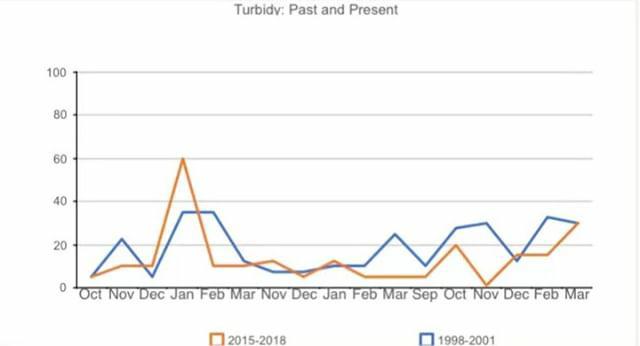
The turbidy was lower in 2015-2019 in Oct & Nov. It was higher in Dec & Jan. It was lower Jan-Mar. It was higher in Nov, and lower in Dec. Then higher Jan, and lower Feb-Dec. It was higher in Feb again, then equal in Mar.
|
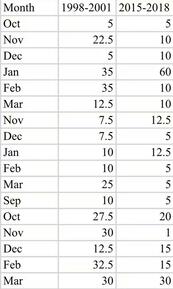
1998-2001: 17.6avg
2015-2018: 12.8 avg Average Difference: 4.8 |
